


Choose one practice topic
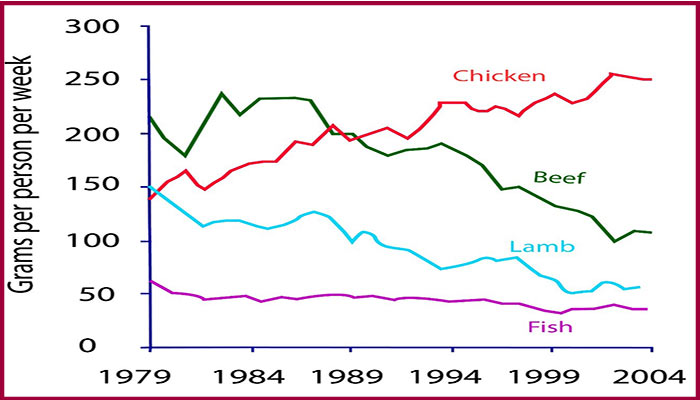
The graph below shows the consumption of fish and some different kinds of meat in a European
country between 1979 and 2004.
Summarise the information by selecting and reporting the main features, and make comparisons
where relevant.
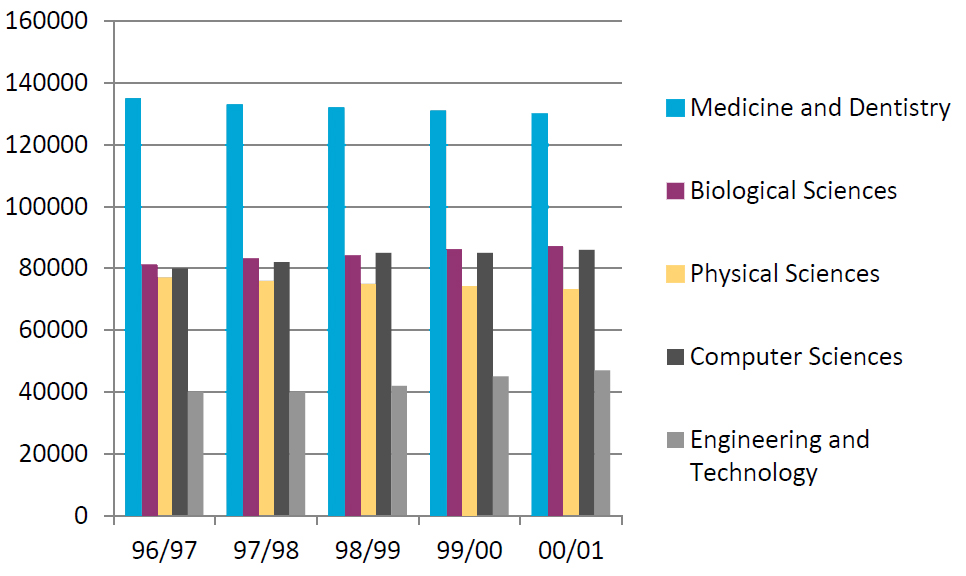
The bar chart illustrates the number of students studying different subjects at university
level over a five-year period.
Summarise the information by selecting and reporting the main features, and make comparisons
where relevant.
The two pie charts below show the percentages of industry sectors' contribution to the
economy of Turkey in 2000 and 2016.
Summarize the information by selecting and reporting the main features and make comparisons
where relevant.

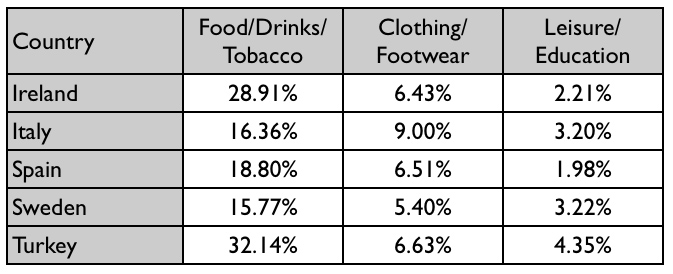
The table below gives information on consumer spending on different items in five different
countries in 2002.
Summarise the information by selecting and reporting the main features, and make comparisons
where relevant.
Lessons Support
Type your question here: